Database monitoring service for Cloud and on-premises users
OVERVIEW
IBM Planning Analytics Administration includes the ability to monitor and administer your databases.
FEATURES DESIGNED
-
Monitor and manage thread activity.
-
Create, Rename and delete database.
-
Start, Stop a database.
-
Configure database.
-
Download database logs files
ROLE
Product designer - Interaction, Visual design, Prototyping & Testing
July 2019 - Dec 2021
Worked on end-to-end design revamp of legacy admin experience to provide a better user interaction for monitoring TM1 databases and for overcoming existing navigational challenges.
In this process, I lead the designs as an Interaction designer and worked along side of Content strategists, Product managers and UI Developers. This project was started in mid 2019 and I was involved till end of 2021.
The design process comprised of IBM Design Thinking activities such as formation of Hills, Empathy mapping, As-Is and To-be scenario mapping. We also worked together with dev and OM for wire-framing sessions to better align with everyone’s understanding with the requirements.
Before handing over designs to another designer, I worked towards making designs compliant with Carbon Design system which was newly introduced in IBM.
We updated designs and released a new version after each feedback cycle with users. I also did usability testing to understand user’s problem areas and what benefits them from the new designs.
All databases
New database

Database created
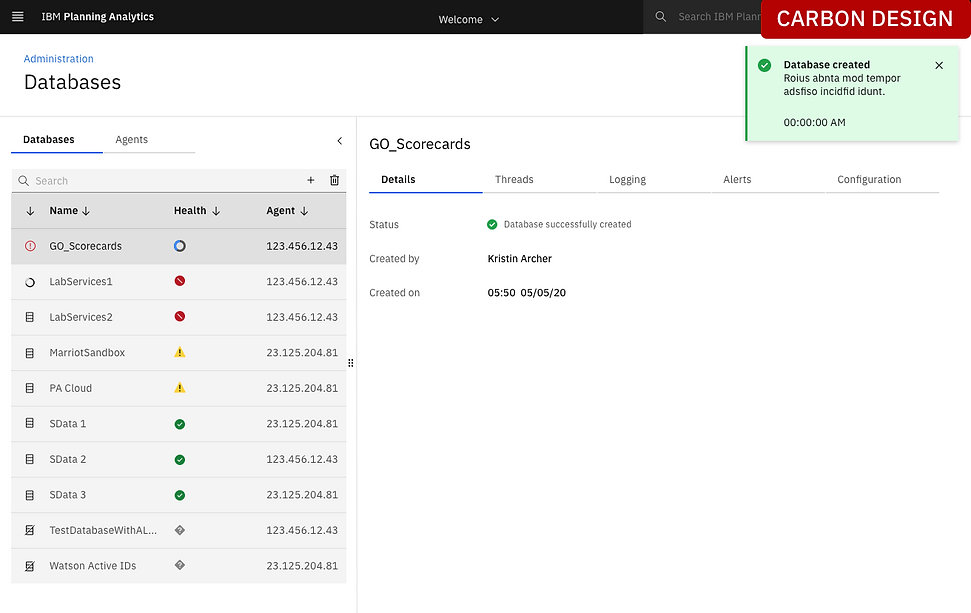
Database selected


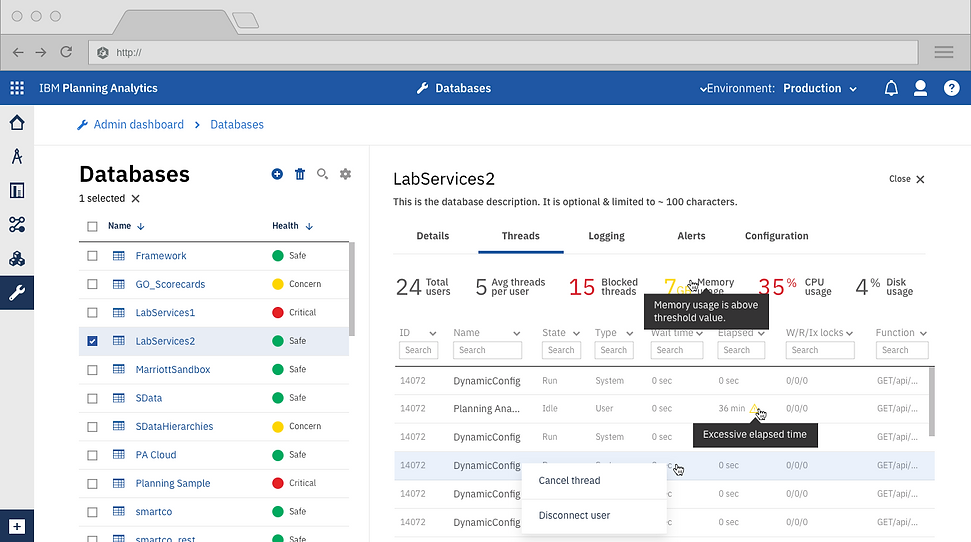
More interactions in database monitoring

Understanding challenges with As-Is

Problem 1: When the product was first created and released as an MVP (around 2015), there were no UX involved, so there was very little consideration for the product limitations on the scope of work.
Solution 1: I did a usability testing with our primary users (admins) to understand and uncover any pain points that they were experiencing with the first few releases. I also facilitated workshops among developers, product managers and dev managers to go over the details project requirements, as-is and to-be scenario mapping along with wire framing sessions.
Problem 2: There were serious accessibility problems in the product. For example; the team of developers used external libraries to create tiles and added only a top border color of Red, Yellow or Green indicating health (critical, warning and good) for the database. We needed a better and accessible solution for this
Solution 2: Added text where there was only images, icons or colors were involved to provide context to users and address accessibility issues.
Early iterations
The UI shows the databases that are available for the user, along with performance metrics. Each database appears on each row and shows the health of the database as 'Safe', 'Concern' and 'Critical'. We overcame another challenge of viewing multiple databases in tiles and not having the real estate to provide other essential details in the same UI.
The Threads tab shows the available running threads on the selected DB.
Logging

Alert settings

Enhancements after further user feedback and with adoption of Carbon Design system

Configuration settings
